From Chaos to Clarity: Smarter Digital Ads Reporting with CTA
By: Jacob Manser, Project Director
If you've run a digital advertising program, you're probably familiar with juggling performance reports from multiple agencies across multiple platforms, none of which look the same. One agency's YouTube report has eight columns, another has thirty. Someone's emailing you an Excel file on Tuesdays, someone else is sharing a Google Sheet and you’re not sure whether this is the version that gets updated or not.
You know the feeling. So you're either spending a ton of time trying to wrangle all of that into something usable, or you've just accepted that you don't have a unified view of your program. Neither is good!
My colleagues at CTA and I have been there, and we know the pain. So we built something to fix it.
Why this is hard
The problem itself is simple: you have data from a bunch of sources, it describes the same things in different ways, and you need it in one place. But solving it requires real data infrastructure, custom cleaning for every report format you're dealing with, domain knowledge about what metrics actually mean across platforms, and coordination with agencies who aren't necessarily going to change their workflows for you.
Most orgs either live with the mess or try to DIY it. The DIY version usually means someone on staff manually joining spreadsheets for hours every week, and by the time it's done the data is stale and it’s too late to draw actionable, timely insights. Enterprise tools like Supermetrics are rigid, expensive, and not built for political programs. Direct API connections to ad platforms can be more expensive and still don't solve for the agency model.
What we built
We've built a pipeline inside PAD, CTA’s integrated data warehouse and analytics platform, that handles all of this end-to-end.
We work directly with your agencies to ingest their reports into PAD however works best for them. Whether it’s a UI to upload a CSV, a Google Sheet connection, or a data warehouse pull, we’ll make it work! The goal is zero friction on the agency side. Then we run every report through a custom transformation pipeline that normalizes it into a single analytics table. A Meta report from Agency A and a Meta report from Agency B end up in the same place, with the same columns, calculated the same way. We do that for every platform, every agency, every report format.
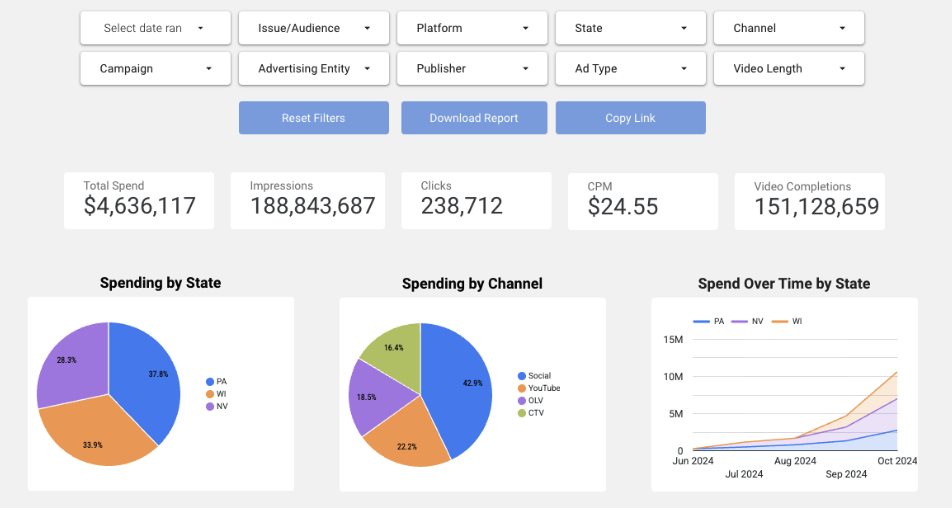
Then, we build a dashboard on top of it which we customize to the exact specs you need to understand your program.
What it gets you
The dashboard is fully interactive. Filter by state, district, agency, platform, channel, creative — whatever dimension matters to your program. A few things our partners have found most useful:
Comparing agency performance side by side, in real time, on the same metrics
Comparing the same creative running across different states and agencies, leveraging that apples-to-apples view that was essentially unattainable before
Tracking total program spend as it happens, instead of reconciling it after the election
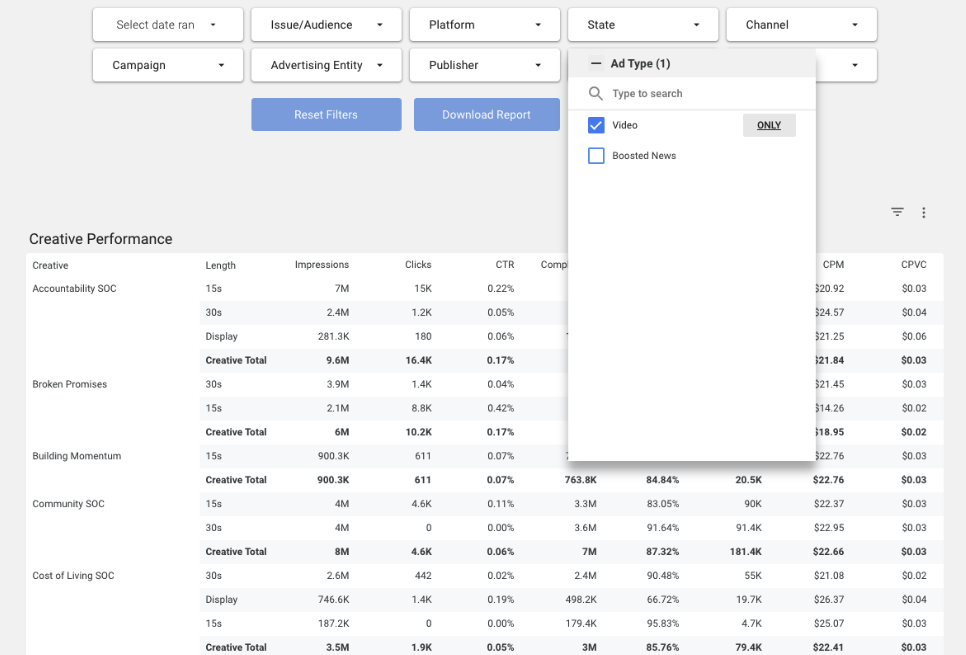
You don't need a data team for any of this. CTA handles the infrastructure, the pipelines, the cleaning, and the reporting. All you have to do is log in! That said, if you do have data staff and want to go deeper, the underlying data is all yours in BigQuery to query, export, or extend.
Getting started
We can spin up quickly! We’ll get on a call to talk through your program and your agencies, then start coordinating and building. A V1 with data flowing and a working dashboard comes together fast, and we’ll iterate together from there.
This model also isn't limited to digital ads — it works anywhere you're stuck manually reconciling data from multiple sources about the same program. Digital advertising is where we started because it's where our partners’ need was most acute, but please feel free to reach out to discuss similar solutions for other kinds of programs.
If it sounds like we could help this cycle or next, we'd love to chat! Connect with us at the form below, or watch our recent webinar for an in-depth look!