The most detailed source of U.S. election data, including federal and statewide races, going back to 2012.
Broken down to the census block level and enriched with voter demographics and vote history, access the most powerful dataset for research, modeling, and analysis
ElectionPAD
What’s Included
-
Complete results for state legislative, statewide, and federal elections since 2012, projected to census blocks.
-
Demographic, economic, and vote history variables aggregated to census blocks since 2012.
-
Google Cloud environment with BigQuery, Google Cloud Platform Tooling and Workflows, Looker Studio, and more, plus support from the CTA team.
-
Stable census block boundaries mean true apples-to-apples analysis
-
Fully hosted and empowered with Google’s Cloud environment with BigQuery, Airbyte, Looker Studio, and more.
See how it works
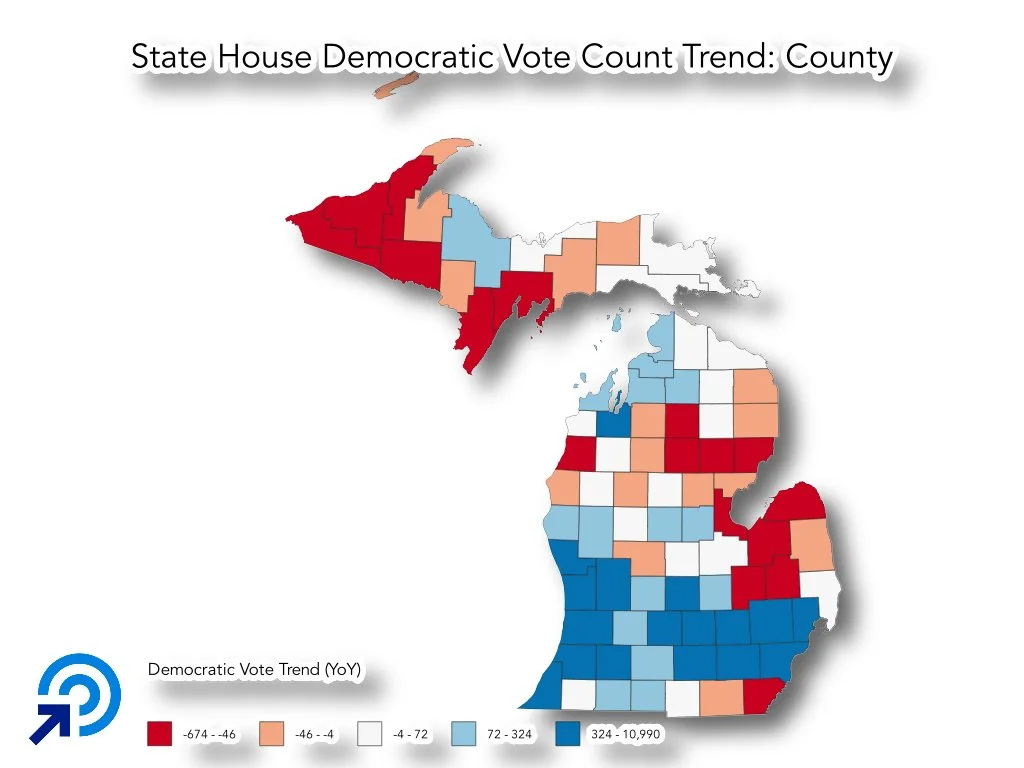
Spot opportunities and trends, run analyses with your tools, and use the power of PAD to see this data in one place. ElectionPAD is not just a snapshot of results, it’s a moving image over time across the same geographies