Data Reporting
Using Google Looker Studio, we ingest and transform data into easy-to-analyze charts, tables, and visualizations, allowing anyone to leverage data for program optimization.
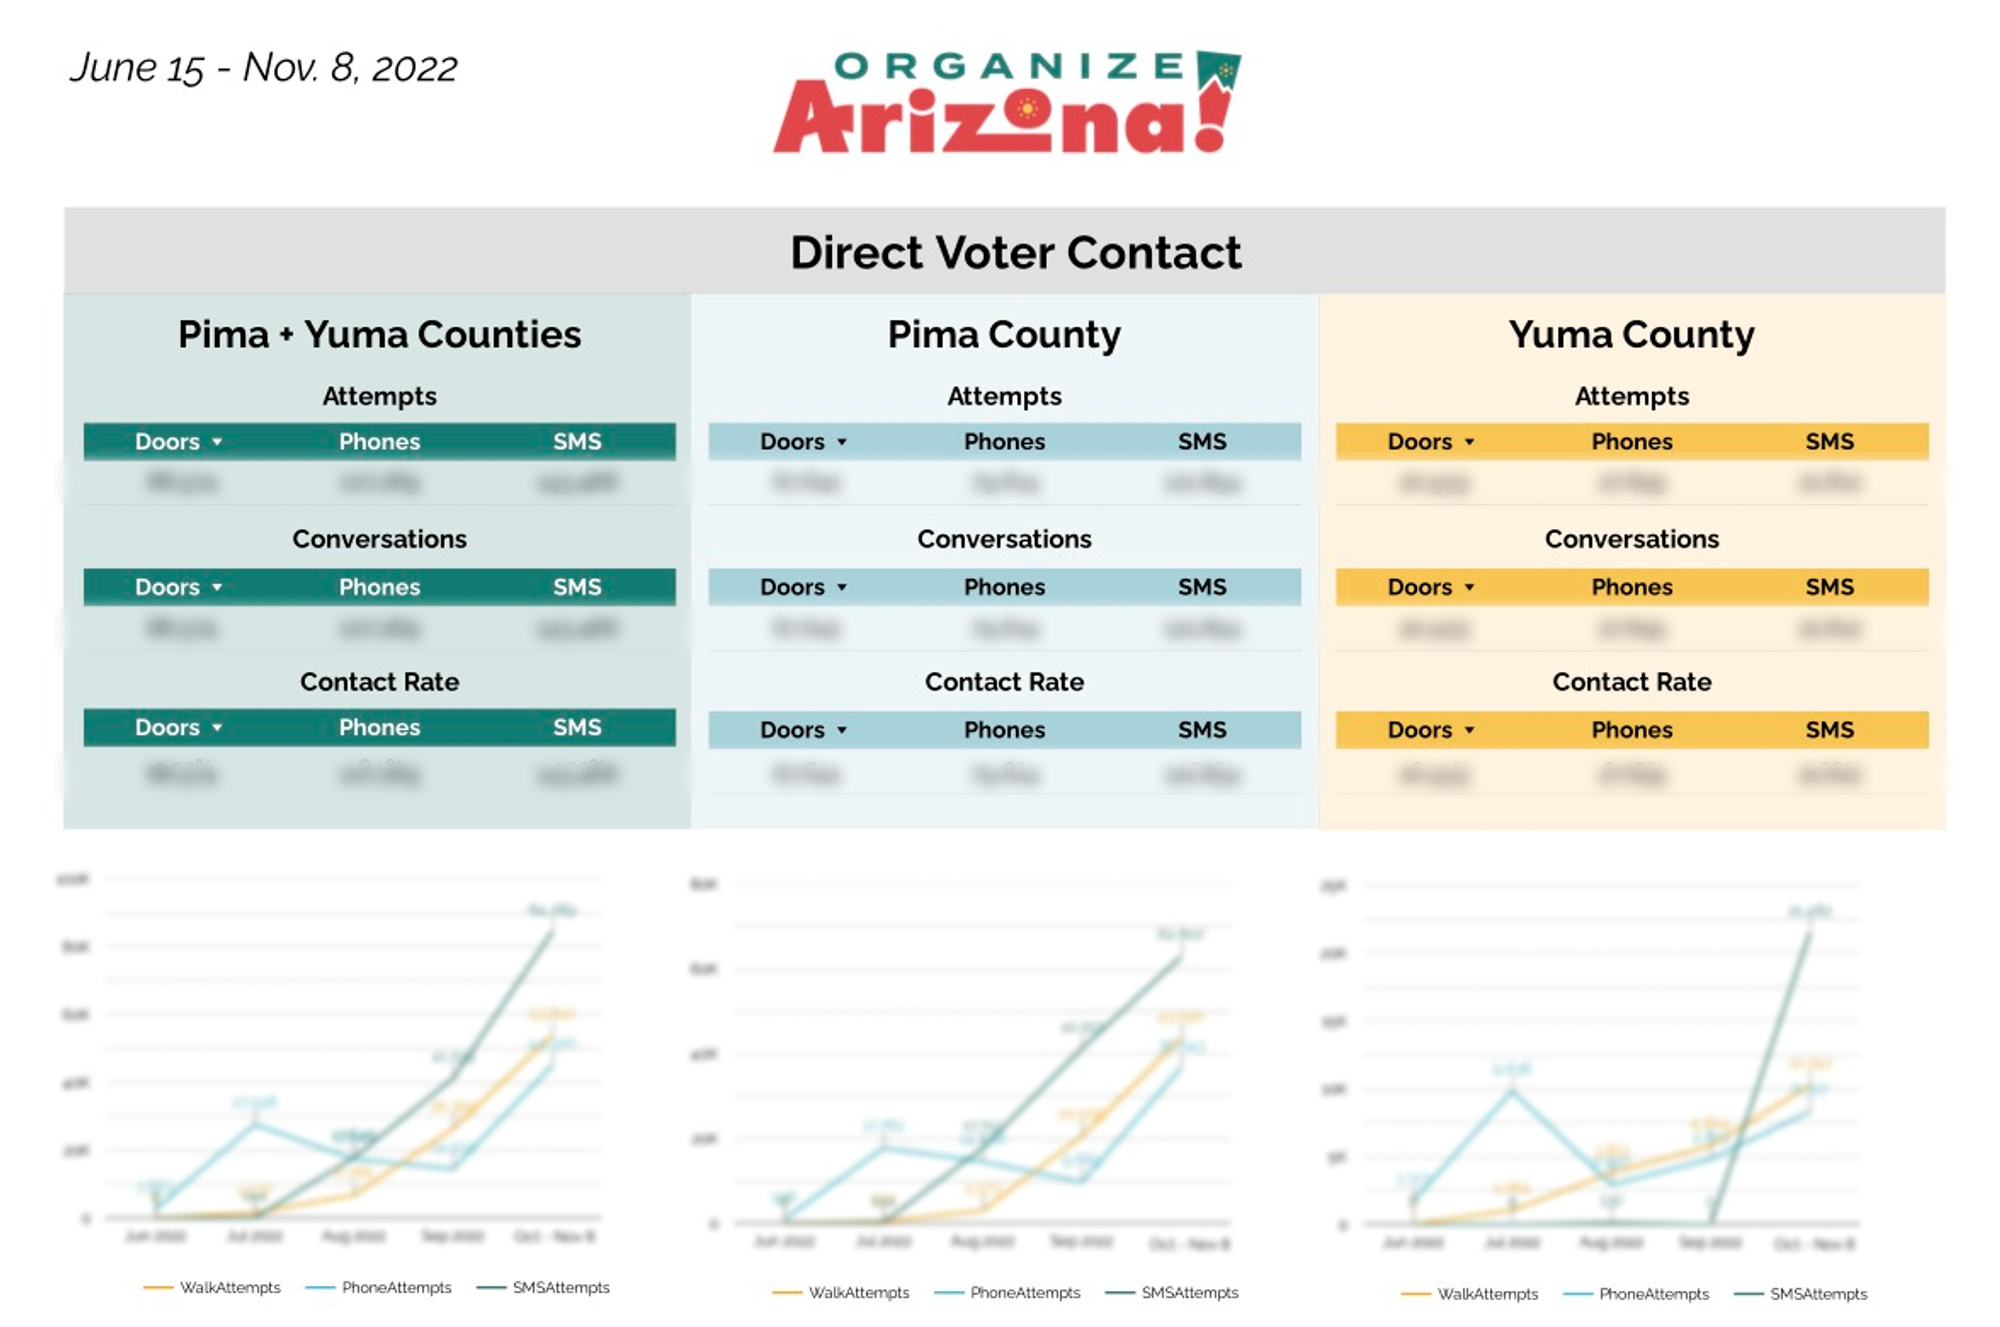
Data in Action
Transform your data into easy-to-analyze dashboards, charts, and maps that anyone — from data analysts, to digital directors, to field volunteers — can create and use.
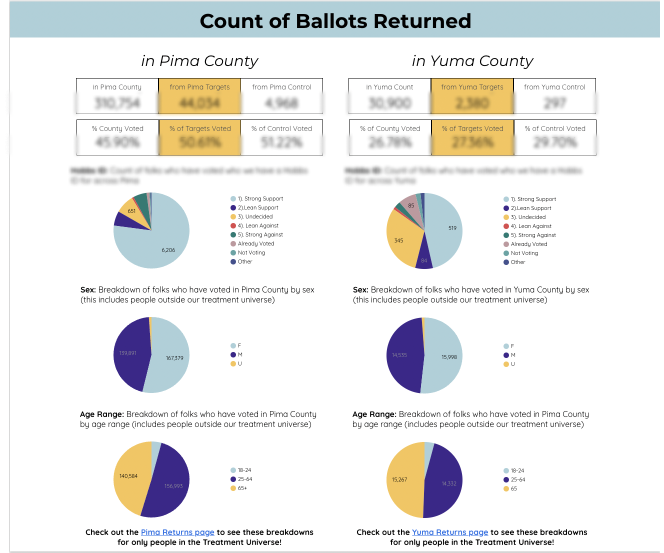
Your Data, In Real Time
Get real-time data into your dashboards without having to wait for overnight syncs. Our data flows from point to point without huge lag time, making it easy to move your data to tools like Google Slides.

Pick Your Platform
Google Looker Studio comes standard with our data warehouse, but we’re able to sync your data to the reporting tool of your choice, including Tableau and Periscope.
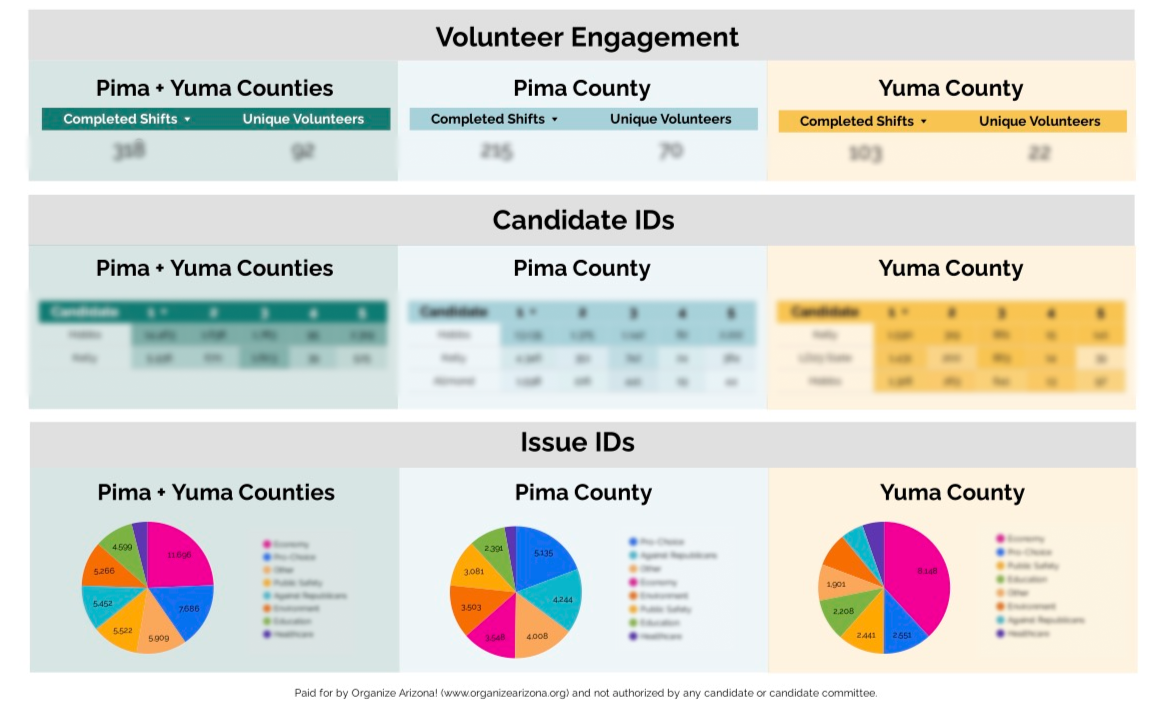
Centralizing real-time data to allow for data-informed decision making.
See Organize! AZ’s dashboards.
Drew, Senior Targeting Director, Equis
"The CTA has been absolutely instrumental to the development of Equis' data systems and infrastructure, and their technical expertise has allowed our team to devote more time and resources to the things we're best at, like analysis and evaluation. Our data team would not be where we are without them!"

More on Data Reporting
-
Building District Dashboards: Impact Action
Teaming up to build a powerful data infrastructure to help Impact and their grantees make informed decisions in real-time
-
Creating Dashboards in Looker Studio
Integrations with Looker Studio can help anyone create dashboards to analyze, understand, and present your data.
-
5 Things You Can Do in PAD that Aren't Writing Queries
Functionalities in our data warehouse that extend beyond just writing queries, including building data visualizations.